 LANGUAGE TOOLS LANGUAGE TOOLS
From version 01.07 LECTOR 2007 contains tools to facilitate
translation and statistical text analysis:
|
 |
SINGLE
WORD TRANSLATION
The single word translation has been introduced to support literary translations.
The scope of this function is to give the user the possibility not only to use a provided
vocabulary but to create and modify own entries.
|
| On [Off] |
You can activate or disactivate the language tools by clicking
on "Language tools" in the tool bar or on Edit->Language tools->On in the main menu.
After activating the language tools, you will see the translation (if there is one)
in the bottom line of the window after clicking on a word in the text or by
pressing <Ctrl><U>. |
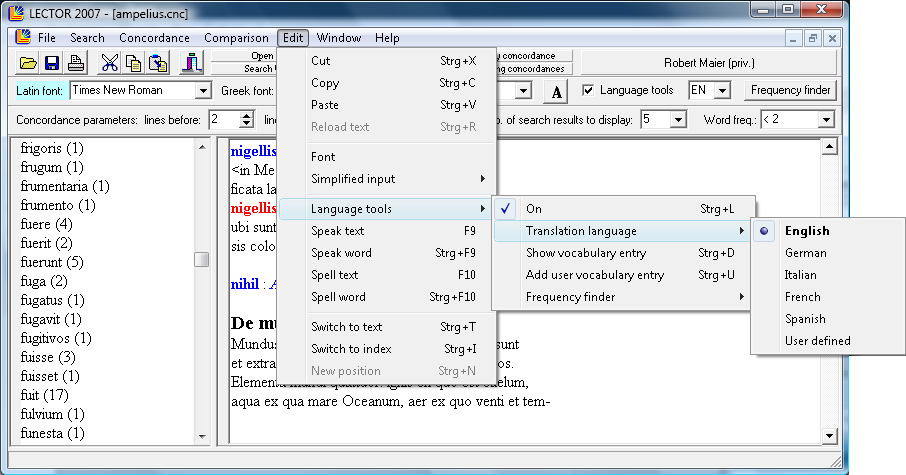
| Translation language: |
You can choose between 6 languages, one of which is a user defined
language. You can choose the translation language from the box after "Language tools"
in the main menu or from Edit->Language tools->Translation language. |
| Show vocabulary entry: |
By clicking on Edit->Language tools->Show vocabulary entry or
by pressing <Ctrl><D> the current vocabulary entry will be shown in a separate
window. |
| Add user vocabulary entry: |
By clicking on Edit->Language tools->Add user vocabulary entry or
by pressing <Ctrl><U> you can add or modify an entry in the user vocabulary. |
|
ADD / CHANGE
VOCABULARY ENTRY
If Language tools are activated you can add or modify an entry in the user vocabulary by
pressing <Ctrl><U> or by clicking on Edit->Language tools->Add user vocabulary entry.
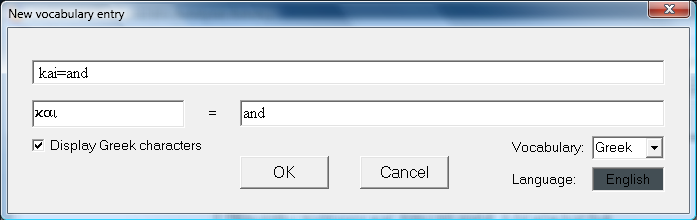
- In the first line the entry of the actual word in the standard vocabulary is displayed.
- The first entry of the second line contains the original word (if you want to switch
to Greek characters click the check box below).
- The second entry of the second line contains the translation.
- At the bottom right the vocabulary language and the translation language are displayed.
You can change the vocabulary language here.
- To reference another entry a pipe sign | has to be inserted before,
e.g.: "est = 3.pers.sg.praes.|esse". References must be located at the end of the line.
It is possible to use up to 15 references.
|
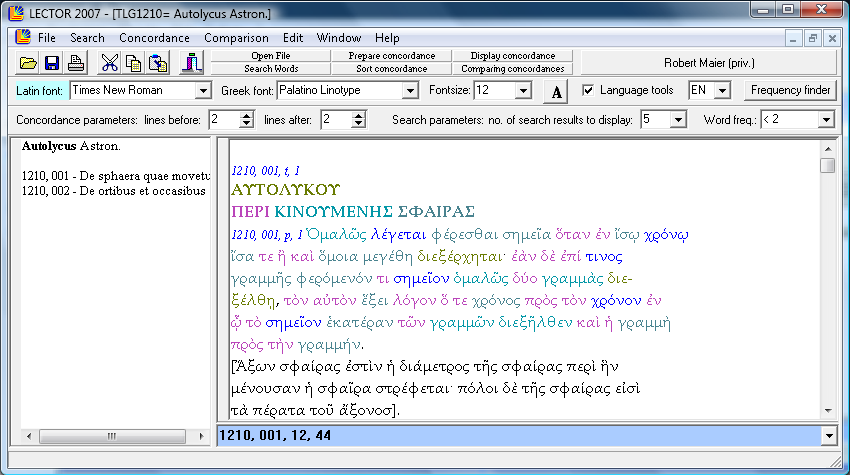
WORD
FREQUENCY MARKING
Word frequency marking gives you some basic statistical view of the text. You can mark words and forms
according to their total frequency in the Latin / Greek literature by different colours.
|
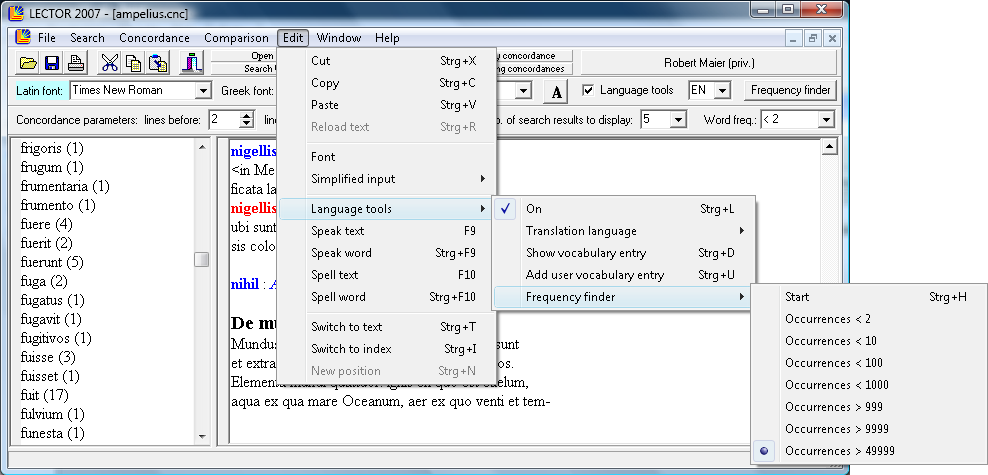
| Start: |
Click on Edit->Language tools->Frequency finder->Start to start the
frequency finder. Alternatively you can start the frequency finder by clicking on "Frequency finder"
or by pressing <Ctrl><H> |
| Occurrences: |
choose the maximum / minimum number of occurrences in the Greek / Latin
literature found on the PHI / TLG CD-ROM from the main menu ("Word freq.") or by clicking
on Edit->Language tools->Frequency finder->Occurrences. The words that apply to the frequency
class you selected will be displayed in different colours. |
Frequency results:
|
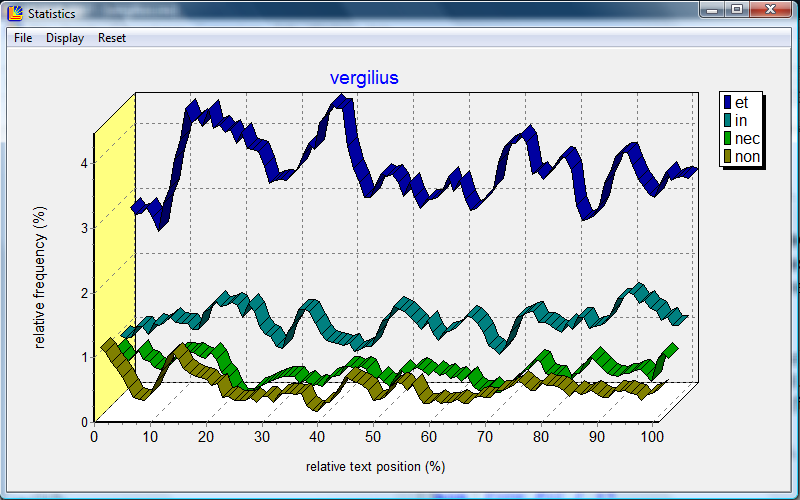
STATISTICS
The statistics window displays statistical data collected by LECTOR.
Statistical data can be collected from the concordance menu.
|
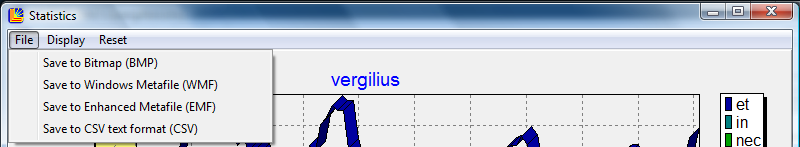
File menu:
|
| Save to Bitmap (BMP): |
The statistics graph will be saved in the Windows Bitmap format (.bmp).
This file format is a pixel graphic format and can be displayed by almost every graphics or
text processing software. |
| Save to Windows Metafile (WMF): |
The statistics graph will be saved in the Windows Metafile format (.wmf).
This file format is a vector graphics format and can be displayed by many graphics or
text processing software. |
| Save to Enhanced Metafile (EMF): |
The statistics graph will be saved in the Enhanced Windows Metafile
format (.emf). This file format is an enhanced version of the Windows Metafile format and
can be displayed by many graphics or text processing software. |
| Save to CSV text format: |
The statistics graph will be saved in the CSV format (.csv).
This file format is a text list format and can be used to export the original numeric data
and to import these tables into other software. Every statistical series is represented
by one column. The columns are separated by ';'. |
|
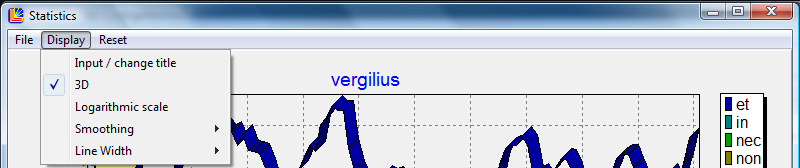
Display menu:
|
| Input / change title: |
By this option you can change the chart title. Normally every set of
data will add the name of its source. The current title will be displayed in the input
field. The source names will be separated by ','. If you want to put in titles which
contains spaces or separators please include them in quotation marks. |
| 3D: |
By this option you can switch between 2D and 3D display. |
| Logarithmic scale: |
By this option you can switch between logarithmic and linear display. |
| Smoothing: |
By this option you can smooth the displayed data. The numbers in the
submenu are a measure of the degree of smoothing. |
| Line Width: |
By this option you can change the line width. The default value of the
line width is 1 if the 3D display is activated, otherwise it is 5. |
|
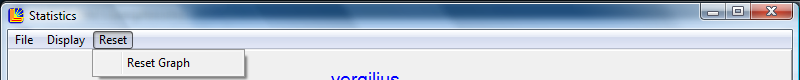
Reset:
|
| Reset graph: |
All data will be cleared and you will be able to set up a new graph. |
|